Showing posts with label guardian. Show all posts

Monday, 13 September 2010

Pope's visit interactives


Pope's visit to the UK

Pope Benedict XVI will visit the UK this week, during which he will beatify Cardinal John Henry Newman, putting him on the Path to sainthood

Two very different interactives from Telegraph.co.uk and the Guardian

Our insightful Telegraph offerings, focus on history of Catholicism and diocese data, where as the Guardian has also excellent background information on Newman and Benedict XVI

Both worthy of perusal and obviously heavily researched

The Catholic Herald and thepaplvisit sites also offer more information

Saturday, 8 May 2010

UK Election infographics


UK Election infographics

Nice clean infographics from the Guardian, Independent, FT and the Daily Telegraph today

And a great proportional representative map from the FT which included constituency names and a label in each corner where a 'swing' had occurred and a colour tab to show from which party

And check out the various online result interactives on the above links

The Guardian has devoted their homepage to infographics

Expect more infographic coverage from the Sunday newspapers tomorrow

Love it!

Thursday, 15 April 2010

General Election leaders' TV debate


General Election leaders' TV debate

Its party time, the 2010 election has finally started, and Nick Clegg has smashed through the "two-party system" in the historic TV debate on ITV tonight

The Telegraph’s verdict

Benedict Brogan says Cameron stayed calm but Clegg got the cream

Janet Daley believes there was no clear winner

And the Telegraph explains that Clegg used the first TV debate to best effect

I agree: Round 1 to the Lib Dems

The Polls
Telegraph: Clegg: 40 per cent, Brown: 16 per cent, Cameron: 44 per cent
Sky: Clegg: 37 per cent, Brown: 32 per cent, Cameron: 31 per cent
ITV: Clegg: 43 per cent, Brown: 20 per cent, Cameron: 26 per cent

All other press is running with the same theme, Guardian, Independent and the Times

Usual press/party bias applies, as expected

Thursday, 8 April 2010

Election erections


Elections erections: its go go time

All the nationals gave it large on Tuesday, massive editorials, mega party-leader pics and huge amounts of infographics

The Times advertised an election map "Free inside" on their masthead

We at the Daily Telegraph produced the UK's favorite election tool – the swingometer – what seats Cameron must win to swing the election in favor of the Conservatives

A huge amount most likely not enough to win an outright majority

Along with swingometers' and general election good election coverage, the Telegraph also interactively helps you how to vote

In the Independent, they produced the last elections results in today's new boundary format

Why?

We are surely used to the Independent producing much more interesting editorial, although one can imagine that most commissioning editors think that the election map of the UK is key to any election...

IT IS NOT

It is a visual lie

For the 2005 election result, while working for the Observer, Cath Levett, Ciaran Hghes and I produced an proportionate example of how the electorate voted (mainly concentrated urban areas in red) and what the constitutional (mainly blue for rural reasons) map compared

The result being a very blue constituency map of the UK, but the majority of votes going to the red of Labour

Please - for any visual reporting for this election, I urge many to look at current graphics from the Guardian, most certainly on Tuesday

It should serve many swell over the next few weeks

Not news based, but excellent and well planned election coverage

The pick of the best being Mark McCormick's online extraveganza

Infographic Caviar indeedy

Wednesday, 31 March 2010

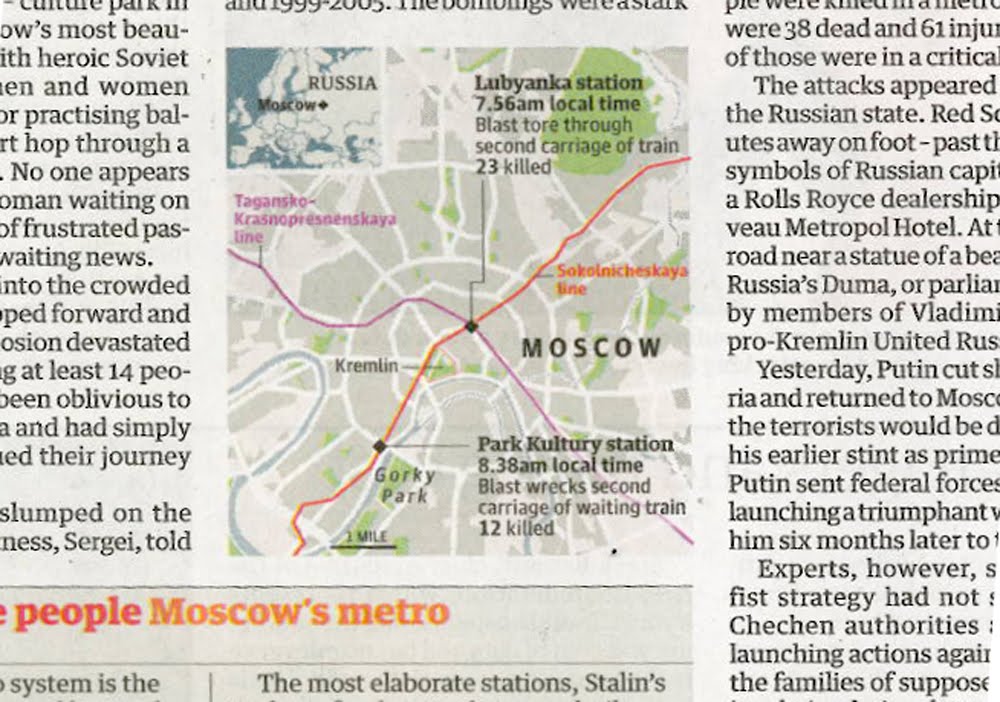
Moscow blasts: UK breaking news maps


Moscow blasts: UK breaking news maps

Maps in Tuesday's news sections, yes Foreign news that has made it to the Home news section

Almost beggars belief, here we start with the Times on page 3, and then we have the Independent, the Guardian, the FT and finally the Daily Telegraph with a map/graphic on their Foreign pages

Interesting that the Independent, the Guardian and the FT all have included the Metro lines of geographical importance

The Times chose not to, and like wise we at the Telegraph. Maybe we at the Telegraph should of, but I guess we were too busy explaining other things, that it was another level of information to much

As well as showing a likeness of the Black Widows, we preferred to show where Chechnya is in location to Moscow, keeping with the flow of the story

For other footage and reporting, please click here for BBC News, and an interactive by the NYT here

Monday, 29 March 2010

Guardian mountain of debt


Guardian mountain of debt

More genius from the Guardian

Something which most colleagues pointed out

And they are right, it is great

Look at how the graphic compares the 2009-10 forecast with Alistair Darling's report

The ghost of that past, haunting our future

Click here for the fab journalism

Friday, 26 March 2010

Robin Hood tax


Robin Hood tax for the rich

What do Gordon Brown, Alistair Darling and Robin Hood have in common?

Quite a lot according to the latest number crunchers at the Institute for Fiscal Studies

As we can see from the charts above from the Independent, Financial Times, Guardian, Daily Telegraph and the Daily Mail, all sourced from the IFS, that the three consecutive Labour governments have redistributed our wealth, from the very rich, to the very poor

At the Telegraph, the hardest part of the chart was choosing the right terminology

Transforming data into information, hard wonk speak into words that you and I can understand

He fares best from the above chartery?

Only you can judge... please do

Wednesday, 27 January 2010

Emerging from recession?


Emerging from recession?

Britain yesterday officially crawled out from recession, and our glorious media presented the same data in many ways and guises

Which is great

Even in the Daily Telegraph we have to graphics, from the front of the Business section, and the other from inside the main News book, showing differing display methods using the same quarterly GDP data

Squire John Bradley rather smartly compared sector against GDP in the Independent, meanwhile on the front page of the FT, a red line showed GDP historical over a map of Britain

Maybe more information – both visual and textual could have emboldened the FT's graphic

The Guardian produced an incredibly clean looking and impressive global recession map online, and presented their beloved and world-altering circle volume/data display – combining complex data in a fantastically simple manner – nothing new at Michael Robinson's graphical data studio

Lastly at the Telegraph, Andrew Blenkinsop produced a beautiful and dramatic graphic for the front page of the Business section, and Caroline Dewar's 'Timeline of Britain's session' added journalistic value to the News section

All great stuff and cheers!

Guardian spreads the data


Guardian spreads the data

A comprehensive data report out in the UK today shows the state of our nation

Harriet Harman calls it an 'Inequality bible'

Over a double truck, the Guardian in print, and in their data blog, have created the space to visualise the data, and reported on by Tom Clark

You can also download the data from this link

Nice work!

Wednesday, 9 December 2009

Pre Budget Report


Fine work by the Guardian today

Infographic analysis, a column wide showing UK GDP sector share between 1970 and 2007

For example in 1970 'manufacturing' was 31.7%, whereas two years ago it checkout out at 12.4% of the UK's core money spinner

Apologies for the poor scan, but the graphic is so clear, and well conceived that only a complete numpty can not see the extremely clear, sector comparisons, ahead of Alistair Darlings' final Pre Budget Report

A great piece of work!

Tuesday, 15 September 2009

Sexism in the city


Cracking graphic by the Guardian today

Pay equality among executives, male and female

Which shows that only five top women executives earn more than the average of all male executives in the FTSE100

The Guardian have ironed out the problem of 'width disparity' of the spiral increments, which received a few words of caution in the industry

But I think this is very clear, and the colour fab

Why read the piece when you can understand the reporting in the infographic

My only concern is that part of the scale in white was printed in the gutter

Bummer!

Tuesday, 2 June 2009

Air accident [3]


Today's print infographics

They do indeed shed some light on this story

These breaking news examples of simplicity and clarity

The Guardian, example 4, is a solid, clear narrative explaining where flight AF447 departed, where it was supposed to arrive, and located where contact was lost with the Airbus

The Telegraph, example 1, shows other details, such as the nationality breakdown of those on the flight, craft details and route information in a very 'graphic' manner, lively and interesting

Although I doubt whether the Airbus landed or that contact was lost over Africa

As yet, nothing has 'rocked my boat', although I have not seen other examples yet, but please, if you come across something interesting, please send them to me

Friday, 1 May 2009

Swine flu: UK press [3]


And there we have it. Day 4

Firstly, lets start with the Times. What the hell (pic 3)? Is anyone supposed to read this? Insane. The Times have produced the greatest of infographics over the past year or so, but this? It's a bio hazard symbol, over a globe, with a load of zero's around it. What kind of editorial decision is this?

Yesterday's heroes, the Independent (pic 1), have finally followed the trend and gone global. Following the hysterical trend of reporting the 'suspected cases', they show where and by what quantity the countries in the spotlight are harbouring their illnesses

The Guardian (pics 4+5) went nuts, over the centre spread, showing the same thing. It feels great. But do we really learn anything new that we don't already know. Similar to the Independent. The global issue was yesterday.

We need to go local. Push the news agenda with infographics. Data maps only get you so far. Why not explain something different? Data is everywhere, on the radio, on TV, on the Internet and all over our newspapers.

So why tell people what they already knew yesterday. OK. This is the life of the printed news. Always playing catch-up. But we should be trying to explain much more...

At the Telegraph (pic 2), not that we are right or wrong, but we decided to develop a different agenda. I had a chat with the online director, who said that users (traffic from Telegraph.co.uk) were not interested in how many cases where around the world, but how it directly involved them.

Basically, what and how the virus was spread, and what happens to the body. So there you are. Our graphic in the Telegraph yesterday. A radically different approach to what the press has covered, but what our readers wanted and needed to know!

Tuesday, 28 April 2009

Swine flu: UK press


Ha ha the swine flu

Bloody hell what a fuss. But great media fodder

These examples were from Monday for Tuesday editions

Sorry - these are the only examples I have

The Guardian produced their classic map with data-driven circles

I must admit that I wanted to do something similar

Indeed I had some 'magic' working, but a senior editor had his doubts

And in a way I slightly agree

If we are all looking at the spread of the disease, then the 'circular method of present the spread is misleading' he said

Great as the Guardian graphic is, does it indicate that the 'suspected' circle has directly contaminated the countries that it covers?

I had not wanted to take this into consideration, because as an example of such, and as the production looks so wonderful, the editor had a major point - that this technique is flawed in this example

I guess, the fall out is, that it is OK to produce the circular data graphics as data graphics, but to overlay over a map can confuse things somewhat

Certainly over a map of the world, which covers millions of miles

It would most certainly work over a localised area map

We at the Telegraph tried too cover to much, I think

The information over the map, which was updated overnight, maybe became a little on the side of 'where do I look first'

Overall I think the desire was fine, we managed to incorporate a timeline of the swine flu, and hint at possible causes. Which added that element 'unintended learning'

My winner was the first infographic, which shows, in a headline manner, which companies were 'winner and losers' from the Mexican disaster


Sunday, 19 April 2009

Koutoubia tower [Marrakesh]


Visual symbolism

I've just returned from a family break in Marrakesh

I superb holiday of sun, culture and harassment.

My hotel was next to the 'Koutoubia mosque', which is the largest in the city and completed under the reign of the Almohad caliph 'Yaqub al-Mansour', and used as a model for the 'Giralda' in Seville.

Such amazing history in Morocco, in a way the melting pot of cultures of the Moors, Arabs and Europeans. 

The minaret of Koutoubia has influenced thousands of church towers in Spain and Eastern Europe

A visual symbol of community, history and our future

Like news platforms, and infographics

Like Zarracina's and Baptista's infographic work in the past for El Correo in Bilbao

Symbolic design with meaning, and a following

Visuals that are replicated across the globe for originality, innovation and quality

What is next in the world of infographics?

The NYT have shown us how data can look cool, and likewise the Guardian

The illustrative caliphs from Bilbao, and likewise Serra at Clarin in Argentina resurrected and developed the hand drawn news presentations not seen in newspapers since the '70s and '80s

So, what is next?

Is it a guarded secret?

Is the latest offshoot of our great and beloved method of explaining the news a mash-up of presenting data published by our readers and online viewers? Allowing them to edit and develop work published by ourselves?

Do we become more community orientated, publishing work off/online for our people rather than our portfolio? 


Wednesday, 8 April 2009

Winning entries from the UK


And here they are
Although I don't have the other from the Guardian, who won two
Congrats to all at the Guardian and the Sunday Times
Although the ST had many days to perfect this, we should not forget it is breaking news
The story changed many times, indeed up until the Saturday morning
And fantastic visuals
Great infographics

Sunday, 29 March 2009

Malofiej 17: 'big red thingy'


OK - I am back from Pamplona, and huge apologies for the lack of visual

Basically, crap photo's from the Blackberry, and I had not organised web access at the hotel, for obvious reasons

But there will be a steady stream of stuff to come

First and foremost, I must congratulate all winners at this years awards

My sincere wishes go to the Guardian and the Sunday Times who won three medals collectively

Great news

I have just come across this great video footage by Brian Rea, former Op-Ed art director of the NYT

Classic!