Showing posts with label NYT. Show all posts

Tuesday, 4 January 2011

SND: Multimedia awards winners


SND: Multimedia and interactive awards winners of 2009

The Best of Multimedia Design winners were awarded at the 2009 Society for News Design annual workshop and exhibition in Buenos Aires on Sept. 24. The competition recognizes skill, innovation and high-quality visual journalism in Web and other new-media design with quarterly and annual awards

Deservedly so, as their work is completely top-notch, 18 out of 32 of gongs were given to the nyt.com

That is 56.25 per cent


Here are the deserved awards:


Awards of Excellence

Anticipating Obama’s Inauguration on a City Block in Washington • nytimes.com

Basketball Database • indystar.com

Cape Fear To Down Here • Carolinaphotojournalism.org

Common Ground • mediastorm.org

Crossing the Line: Abuse in Hawaii Homes • honoluluadvertiser.com

Electoral Explorer • nytimes.com

I Hope So Too • nytimes.com

Immigration Explorer • nytimes.com

The Last Minutes of Flight 3407 • nytimes.com

How Lezak Won Gold in the 4×100-Meter Relay • nytimes.com

Madison Budget Game • madison.com

A Map of Olympic Medals • nytimes.com

The Presidential Inauguration of Barack Obama • ap.org

Sacred Ground: The Building of the Pentagon Memorial • washingtonpost.com

U.S. Hospital Death Rates • usatoday.com


Bronze Award

A Day’s Work, Four Days’ Pay • nytimes.com

Election Results 2008 • nytimes.com

Failed Prostate Procedures at the Philadelphia V.A. • nytimes.com

Intended Consequences • mediastorm.org

Jackson’s Billboard Rankings Over Time • nytimes.com

Murder: New York City • nytimes.com

New York Plane Crash • boston.com

Pogue-O-Matic Product Finder • nytimes.com

War Without Borders: Fueling Mexico’s Drug Trade • nytimes.com


Silver Award

Andaman Rising • carolinaphotojournalism.org

Hurricane Tracker • msnbc.com

Indy 500 Car Tracker • indystar.com

One in 8 Million • nytimes.com

Ted Kennedy • boston.com

Tracking US Airways Flight 1549 • nytimes.com


Gold Award

Choosing a President • nytimes.com

You Finish, You Win • nytimes.com


The nyt.com also claimed the Judges Special Recognition

Brilliant and congrats to all winners

Wednesday, 15 December 2010

NYT maps every city and every block


NYT maps every city and every block in the United States

A wonderful interactive, as always, from the New York Times

Based on samples taken from the Census Bureau's American Community Survey during 2005 and 2009, this interactive enables us to understand the distribution breakdown of racial and ethnic groups across the country

Looking at the data viz in the map of Manhattan, check out the ethnic divide along East 97th Street

Also impressive, although not surprising is the yellow glow of Miami

Interesting facts from the editorial:

Nine jurisdictions had populations in which more than one-third of their residents were foreign-born. These included three counties in California (Los Angeles, Santa Clara and San Francisco), two county equivalents in Alaska (Aleutians East Borough and Aleutians West Census Area) and two counties in New York (Kings and Queens)

There were 292 counties with populations that were less than 1 percent foreign-born, including 34 counties in Kentucky, 27 in West Virginia, 26 in Missouri and 21 in Mississippi

Interactive caviar indeed!

Tuesday, 3 August 2010

NYT Stop, Question and Frisk


NYT Stop, Question and Frisk interactive

Click here to enjoy another fantastic data interactive by the NYT

New York City’s police force, in its fight against crime, has increasingly used a strategy known as “stop, question and frisk,” which allows officers to stop someone based on a reasonable suspicion of crime. One expert has estimated New Yorkers are stopped at twice the national rate

Circles indicate the number of "stops" at each address or location in 2009 as reported by the NYPD

REAL data visualisation with meaning

Information caviar!

Thursday, 27 May 2010

Oil Spill tracker


Oil spill tracker

A fantastic interactive by the New York Times which allows the user to track the spill from the initial blowout

But the detail is also in the graphic reporting...
About the Oil Slick Areas Shown on the Map

The “probable extent” of the oil slick is an estimate by the National Oceanic and Atmospheric Administration of where oil is mostly likely to go based on wind and ocean current forecasts, as well as analysis of aerial photography and satellite imagery. The “observed extent” show areas where oil was visible on the surface of the water during aerial surveys of the Gulf. The observed extents are not available every day. The extents may vary widely from day to day because of changes in wind patterns and ocean currents.


But also check the 'estimate' of oil spilled in the chart, on the right of the interactive...

Marvelous!

Tuesday, 4 May 2010

NYT [Europe's Web of Debt]


Excellent graphic by the New York Times

And a great blog by JAG

He thinks that Spain could be the next Greece

Interestingly he comments that the Spanish bankruptcy will destroy the Euro and damage the economies of the French, German and the British

Expect a bigger crisis

Monday, 3 May 2010

NYT bombtastic


NYT bombtastic

Fantastic breaking news infographic by the New York Times

Using Google Earth to create the 'scene' and usual Photoshop and Illustrator techniques to edit the visuals

This print graphic and also published online enabling 'links' to connect with other video and related articles

Here is the NYT timeline

The Events Saturday Night
6:28 p.m The Nissan S.U.V. first appears on surveillance cameras driving west on 45th Street

MINUTES LATER Two vendors see smoke coming out of the S.U.V. and alert the police

THE NISSAN PATHFINDER Police have identified the vehicle’s registered owner. The rear license plate belongs to another vehicle that is in a repair shop in Connecticut

THE SUSPECT Police are examining video of a white man in Shubert Alley looking back toward West 45th Street

Wednesday, 31 March 2010

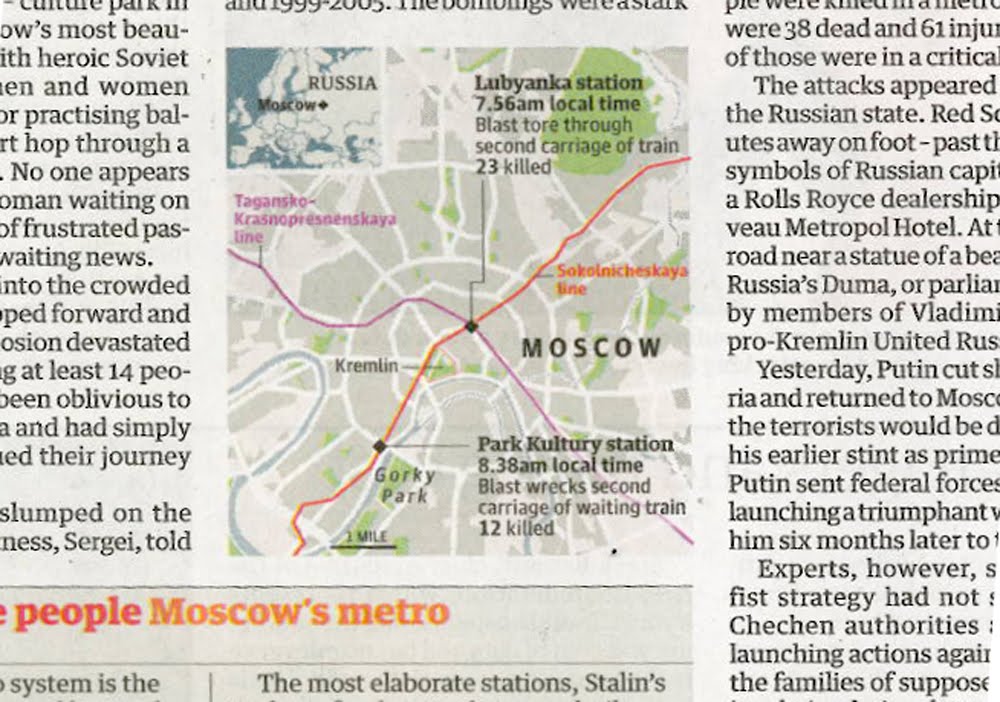
Moscow blasts: UK breaking news maps


Moscow blasts: UK breaking news maps

Maps in Tuesday's news sections, yes Foreign news that has made it to the Home news section

Almost beggars belief, here we start with the Times on page 3, and then we have the Independent, the Guardian, the FT and finally the Daily Telegraph with a map/graphic on their Foreign pages

Interesting that the Independent, the Guardian and the FT all have included the Metro lines of geographical importance

The Times chose not to, and like wise we at the Telegraph. Maybe we at the Telegraph should of, but I guess we were too busy explaining other things, that it was another level of information to much

As well as showing a likeness of the Black Widows, we preferred to show where Chechnya is in location to Moscow, keeping with the flow of the story

For other footage and reporting, please click here for BBC News, and an interactive by the NYT here

Monday, 29 March 2010

NYT – the art of total journalism


NYT – the art of total journalism

This online report by the New York Times, is possibly, one of the finest of any modern journalism, shows us that the efficiency of footwork is the key to Federer's success

Introduced as a winner in Pamplona, its got the lot

You don't need to be a tennis fan to love this

For me – the best

Voice over from a tennis coach, animation, diagrammatics, video footage and clickable navigation, this project surely points the forward for any media organisation wanting to discover the next level of journalism

It should also be noted, that this reporting could never work on TV as the viewer can control what he/she wants to view, it is visual and so would not work on radio, and because it is animated it leaves print journalism in its slipstream

Although accepted, I recognise that we could extrapolate what we need and produce in illustrator for the print news edition

But this is not the point

This is the power of online journalism, about recognisable forms and people

Visual reporting that transcends infographics

For general society, for the future

Who needs TV when you can watch an iPhone app, or what is new on your iPad?

And a future shaped by infographic editors

Monday, 8 February 2010

Jalalabad to Kabul highway


The highway between Kabul and Jalalabad with scenes of beauty and terror

A fantastic online editorial by the NYT illustrates the danger for most Afghans who dare to drive along the country's most treacherous road, where scores are killed or injured

The Kabul-to-Jalalabad road was paved for the first time by the West German government in 1960. In the 1980s, it was almost entirely obliterated during the insurrection against the Soviet invasion. In the decade that followed, when the Taliban and other armed groups fought to control the country, the road was a blasted moonscape

The piece poignantly ends with some apt dialogue which I guess sums up the motoring skills of an Afghan, even an educated Afghan...

Each day, the broken and bloody arrive at the Sarobi Hospital, a small clinic in the town at the head of the gorge.

“Most of our patients were injured in accidents,” said Ros Mohammed Jabbar Khel, the chief surgeon.

Dr. Jabbar Khel has a plan to buy a fleet of ambulances and stage them at various points along the gorge. That way, he figures, he could save a lot of lives. He said he was waiting for the money to come from the government in Kabul.

Dr. Jabbar Khel himself drives the gorge several times a week. And each time, he said, he is filled with fear — not for his own abilities, but for those of the others.

“I have a license!” the doctor said. “I took lessons!”

Bloody Hell!

Wednesday, 20 January 2010

Haiti disaster cartography


Haiti disaster cartography

They've done it again at the New York Times

To coin a phrase from my good friend JAG at Innovation, this is pure infographic caviar

Super text and visual reporting, supporting a very impressive topographic relief map

However does the wonderful rendering of the mountain range enable us to understand which areas of Port-au-Prince are badly effected by the earthquake?

Is the mountain range and the visualisation of the 'valley' important in the story telling?

Maybe!

Whatever the answer, now I know what the Port-au-Prince area looks like

Please leave comments below, I think that this is an interesting debate to have

Cheers

Monday, 19 October 2009

Job cuts at the New York Times


Juan Antonio Giner analysis is spot on again

Here is a snippet of Bill Keller's memo to the staff of the New York Times

Let me cut to the chase: We have been told to reduce the newsroom by 100 positions between now and the end of the year.
We hope to accomplish this by offering voluntary buyouts. On Thursday, the Company will be sending buyout offers to everyone in the newsroom. Getting a buyout package does NOT mean we want you to leave. It is simply easier to send the envelopes to everyone. If you think a buyout may be right for you, you have up to 45 days to decide whether you will accept it or not.
As before, if we do not reach 100 positions through buyouts, we will be forced to go to layoffs. I hope that won’t happen, but it might.


Not so long ago, Keller said on further layoffs at the NYT, "The answer is no... No I do not see another round of newsroom staff reductions on the horizon."

Giner's statement on this: MORE CUTS, LESS CHANGE

Read his post @ www.innovationsinnewspapers.com

Sunday, 24 May 2009

Paper cuts?


Philadelphia has all modern America can offer, for better or for worse: wealth, crime politics, sport, art and culture. But what it might not have soon is a newspaper

Within every city, every newspaper has its problems such as the LA Times, NY Times, Boston Globe. Some newspapers have already died, The Rocky Mountain News, Denver, in print and business since 1859, and the Seattle Post-Intelligencer, which is now a web-only operation also gave up the ghost after 136 years of print

Paul Harris writes an excellent piece in today's Observer

You can choose metaphors to illustrate how technologically outdated newspapers have become in a media landscape dominated by blogs and the internet. They are vinyl records in an iPod world; videotapes in the era of DVDs and Hulu; typewriters in the face of the laptop. They are an old technology no one wants, needs or, increasingly, seems to care for. Certainly not in Philadelphia, where both the Inquirer and the Daily News are in bankruptcy

Monday, 20 April 2009

Boston Globe [2]


The latest on the plight of the Boston Globe

James Vaznis on an interesting piece, that Mass. Democrat Senator John F Kerry is to hold hearings on the financial problems facing the newspaper industry in the US, where dwindling advertising revenue forcing the closure of many papers

I hope that these discussions will allow companies to think, and innovate with new business models, as they currently, and clearly DO NOT WORK

Earlier this month, owners of the Boston Globe, the  NYT Co, threatened to shut down the Globe unless unions agreed to $20 million in cost concessions, as the paper is on track to lose $85 million this year

Crikey - this is a lot of money, although bugger all compared to what the financial institutions have cost the tax payer in trillion dollar bail-outs

On this note, with interest Jeff Jarvis has always a good opinionated rant. A great column in today's Guardian Media section, although he can be read on his sight buzzmachine.com

"Newspapers looking for fault in their fall need look no farther than the buttons on their bellies. The Atlantic magazine has just published a survey of a handful of esteemed, mostly print, American journalists and two-thirds of them said the internet is harmful to journalism. Well, the web has been harmful to the maintenance of their comfortable hegemony over news and advertising. But in truth, the internet presents no end of opportunity to them. They didn't grab it. They blew it"
Great stuff. Always hitting the nail on the head. Jarvis signs off with:

When papers die, there will be silence, confusion and chaos and a few bad guys will escape the watchful eye of journalism. The good news is this: into this crying need, this vacuum, entrepreneurs will rush. And finally, journalism will get the reinvention it has been waiting for...

Ahmen!

Sunday, 19 April 2009

Koutoubia tower [Marrakesh]


Visual symbolism

I've just returned from a family break in Marrakesh

I superb holiday of sun, culture and harassment.

My hotel was next to the 'Koutoubia mosque', which is the largest in the city and completed under the reign of the Almohad caliph 'Yaqub al-Mansour', and used as a model for the 'Giralda' in Seville.

Such amazing history in Morocco, in a way the melting pot of cultures of the Moors, Arabs and Europeans. 

The minaret of Koutoubia has influenced thousands of church towers in Spain and Eastern Europe

A visual symbol of community, history and our future

Like news platforms, and infographics

Like Zarracina's and Baptista's infographic work in the past for El Correo in Bilbao

Symbolic design with meaning, and a following

Visuals that are replicated across the globe for originality, innovation and quality

What is next in the world of infographics?

The NYT have shown us how data can look cool, and likewise the Guardian

The illustrative caliphs from Bilbao, and likewise Serra at Clarin in Argentina resurrected and developed the hand drawn news presentations not seen in newspapers since the '70s and '80s

So, what is next?

Is it a guarded secret?

Is the latest offshoot of our great and beloved method of explaining the news a mash-up of presenting data published by our readers and online viewers? Allowing them to edit and develop work published by ourselves?

Do we become more community orientated, publishing work off/online for our people rather than our portfolio? 


Sunday, 29 March 2009

Malofiej 17: NYT - Peter Sullivan/Best of show


The NYT and NYT.com shared the Peter Sullivan/Best of Show during the 17th Malofiej awards

The jury decided to unanimously award this printed and online coverage entitled 'The Ebb and flow movies: box office' which explains in detail the weekly box office receipt from all movies opened in the US during the last three decades - developed by Amanda Cox

Although, my first impressions were a little 'grey' I guess the 'curves of pleasure' and sheer ingenuity and audacity swung the jury

Which leads me to think that there are two clear distinctions in our world of infographics;

those which are rendered by the experience, limitations and knowledge via our brain

and those which are rendered by the experience, limitations and knowledge via developed data software

Trust me, neither is better or worse than the other - both are valid and exceptional ways to communicate

I guess the industry faced the same emotional debate between those who had trained to illustrate by hand, and those on the computer

Of course the latter is purely design to number crunch, and develop data-driven infography

But most importantly the biggest difference is in the language we use; 'developer' and 'data-driven' rather than 'artist' and 'illustrate'...

... indeed both allow the infografista to communicate their content and idea

But the word on the street is that some fear the death of their traditional trade; I don't thinks so - its just another branch of the infographics tree

Malofiej 17: 'big red thingy'


OK - I am back from Pamplona, and huge apologies for the lack of visual

Basically, crap photo's from the Blackberry, and I had not organised web access at the hotel, for obvious reasons

But there will be a steady stream of stuff to come

First and foremost, I must congratulate all winners at this years awards

My sincere wishes go to the Guardian and the Sunday Times who won three medals collectively

Great news

I have just come across this great video footage by Brian Rea, former Op-Ed art director of the NYT

Classic!